Space Environment Statistics
Environment Report
The latest Space Debris Environment Report issued by ESA's Space Debris Office is available here. The tenth edition has been released on 01/05/2026, with updates related to future environment evolution, on-ground re-entry casualty risk, and the new February 2026 MASTER population released on 08/09/2026.
Environment Statistics
Last update: 31 July 2026
Space debris by the numbers
- Number of rocket launches since the start of the space age in 1957
- About 7320 (excluding failures)
- Number of satellites these rocket launches have placed into Earth orbit
- About 27500
- Number of these still in space
- About 18850
- Number of these still functioning
- About 15900
- Number of space objects regularly tracked by Space Surveillance Networks and maintained in their catalogue
- About 47210
- Estimated number of break-ups, explosions, collisions, or anomalous events resulting in fragmentation
- More than 660
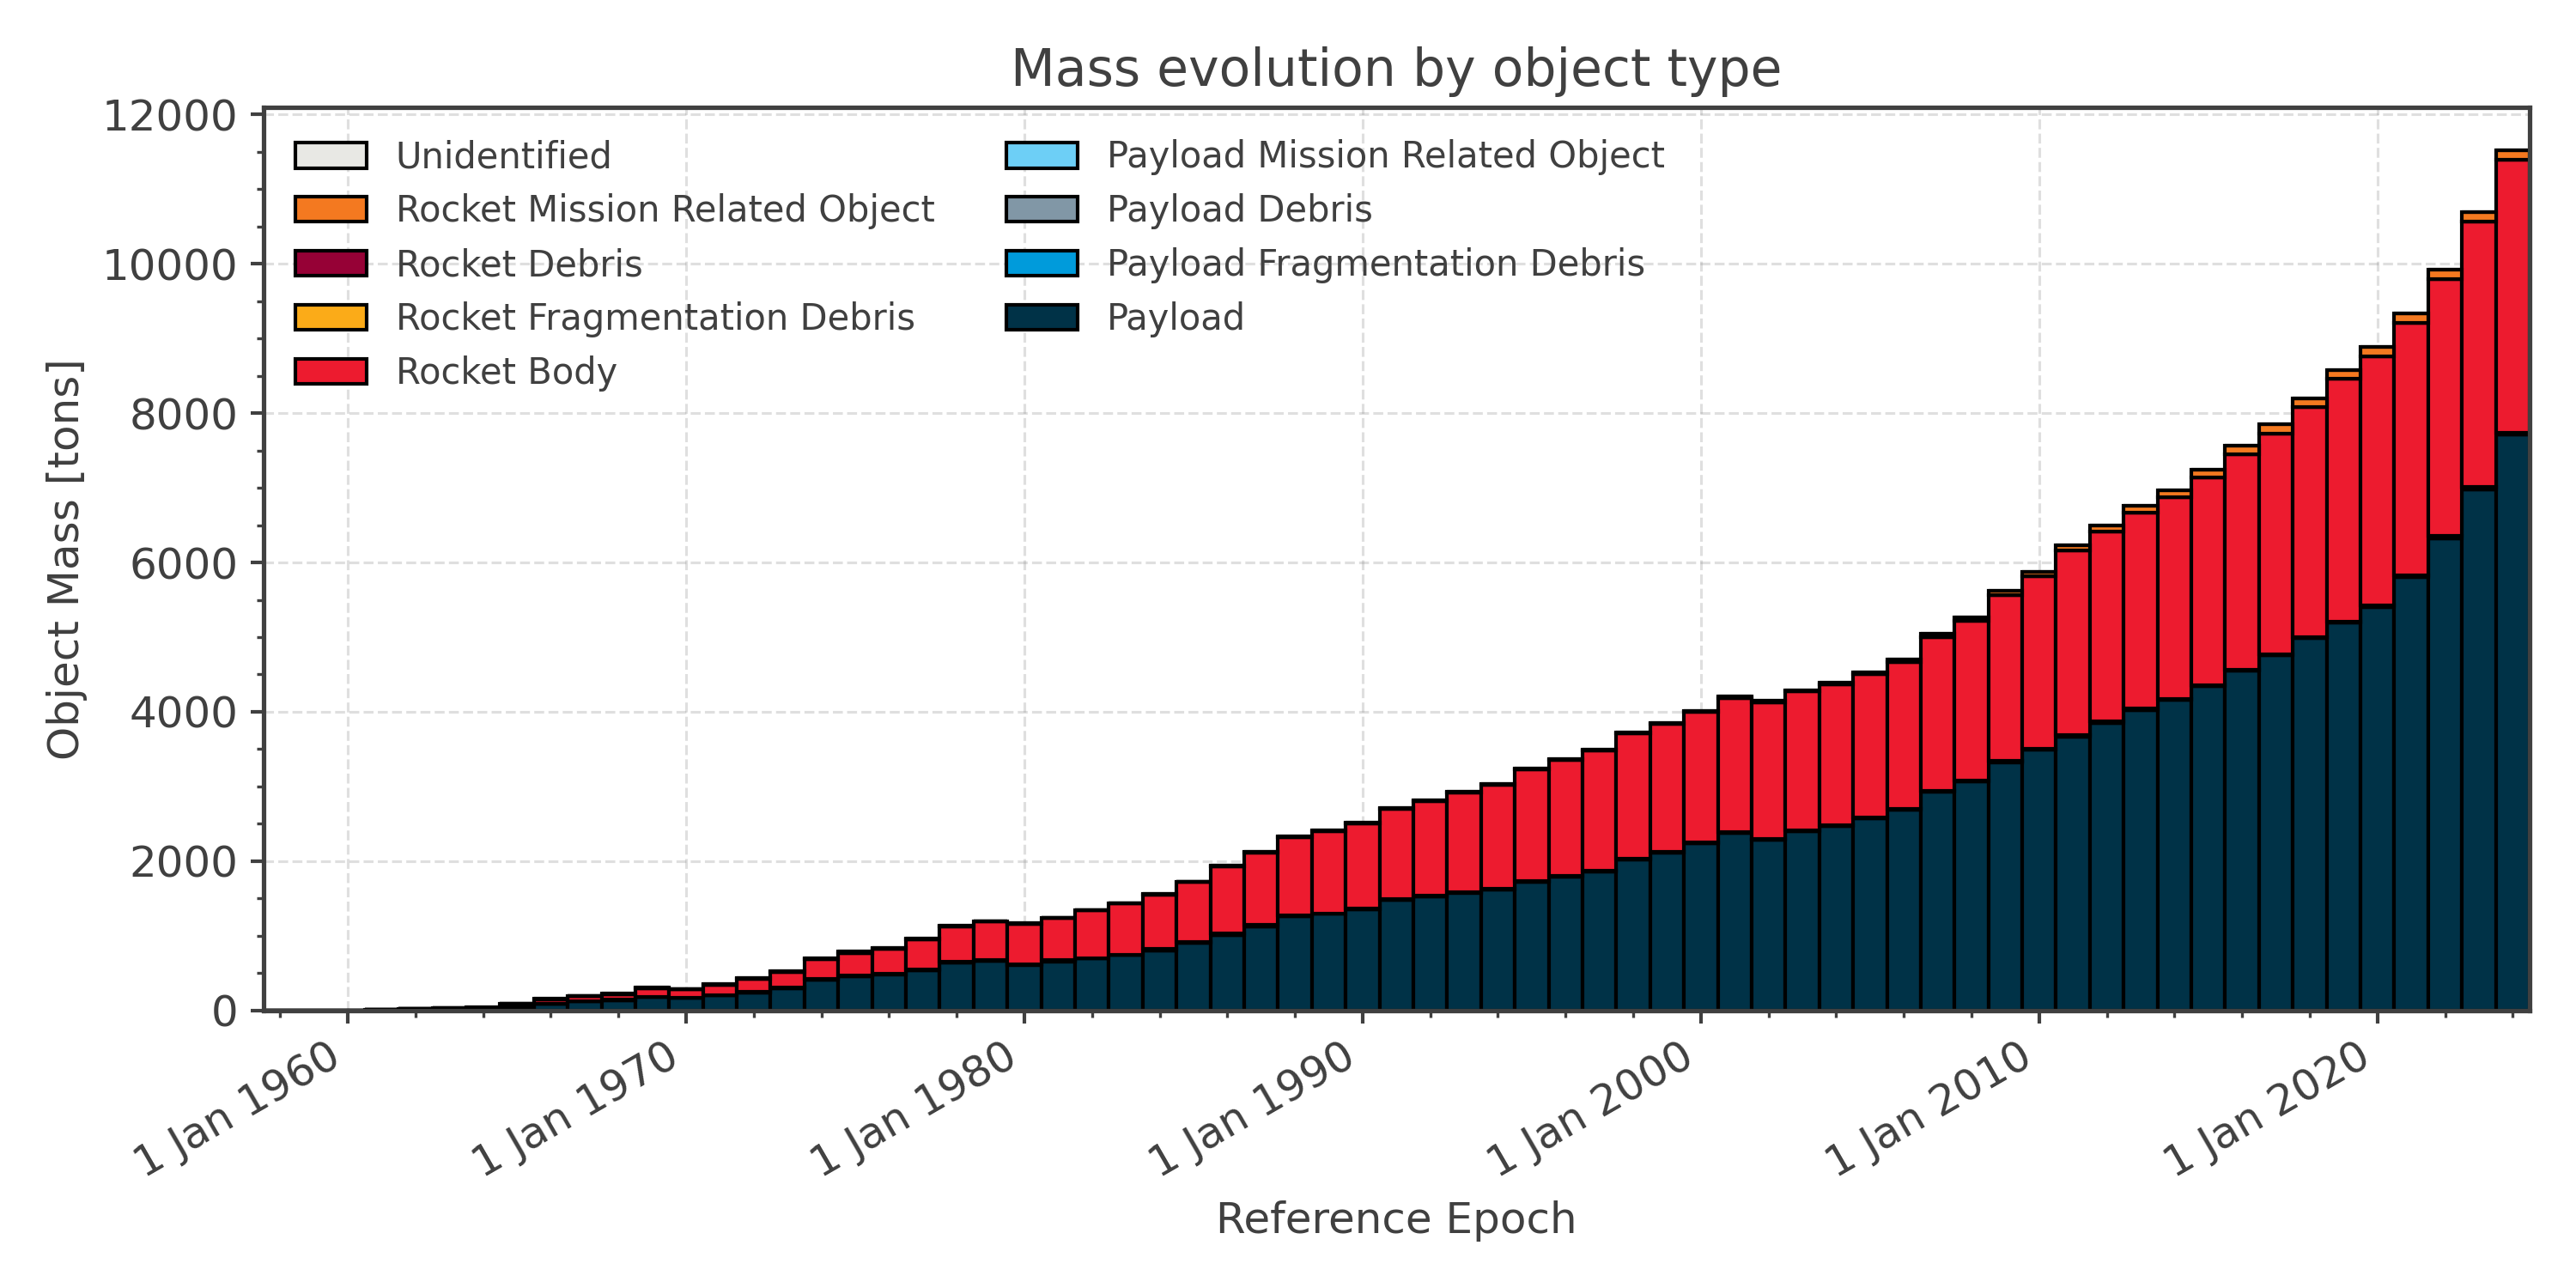
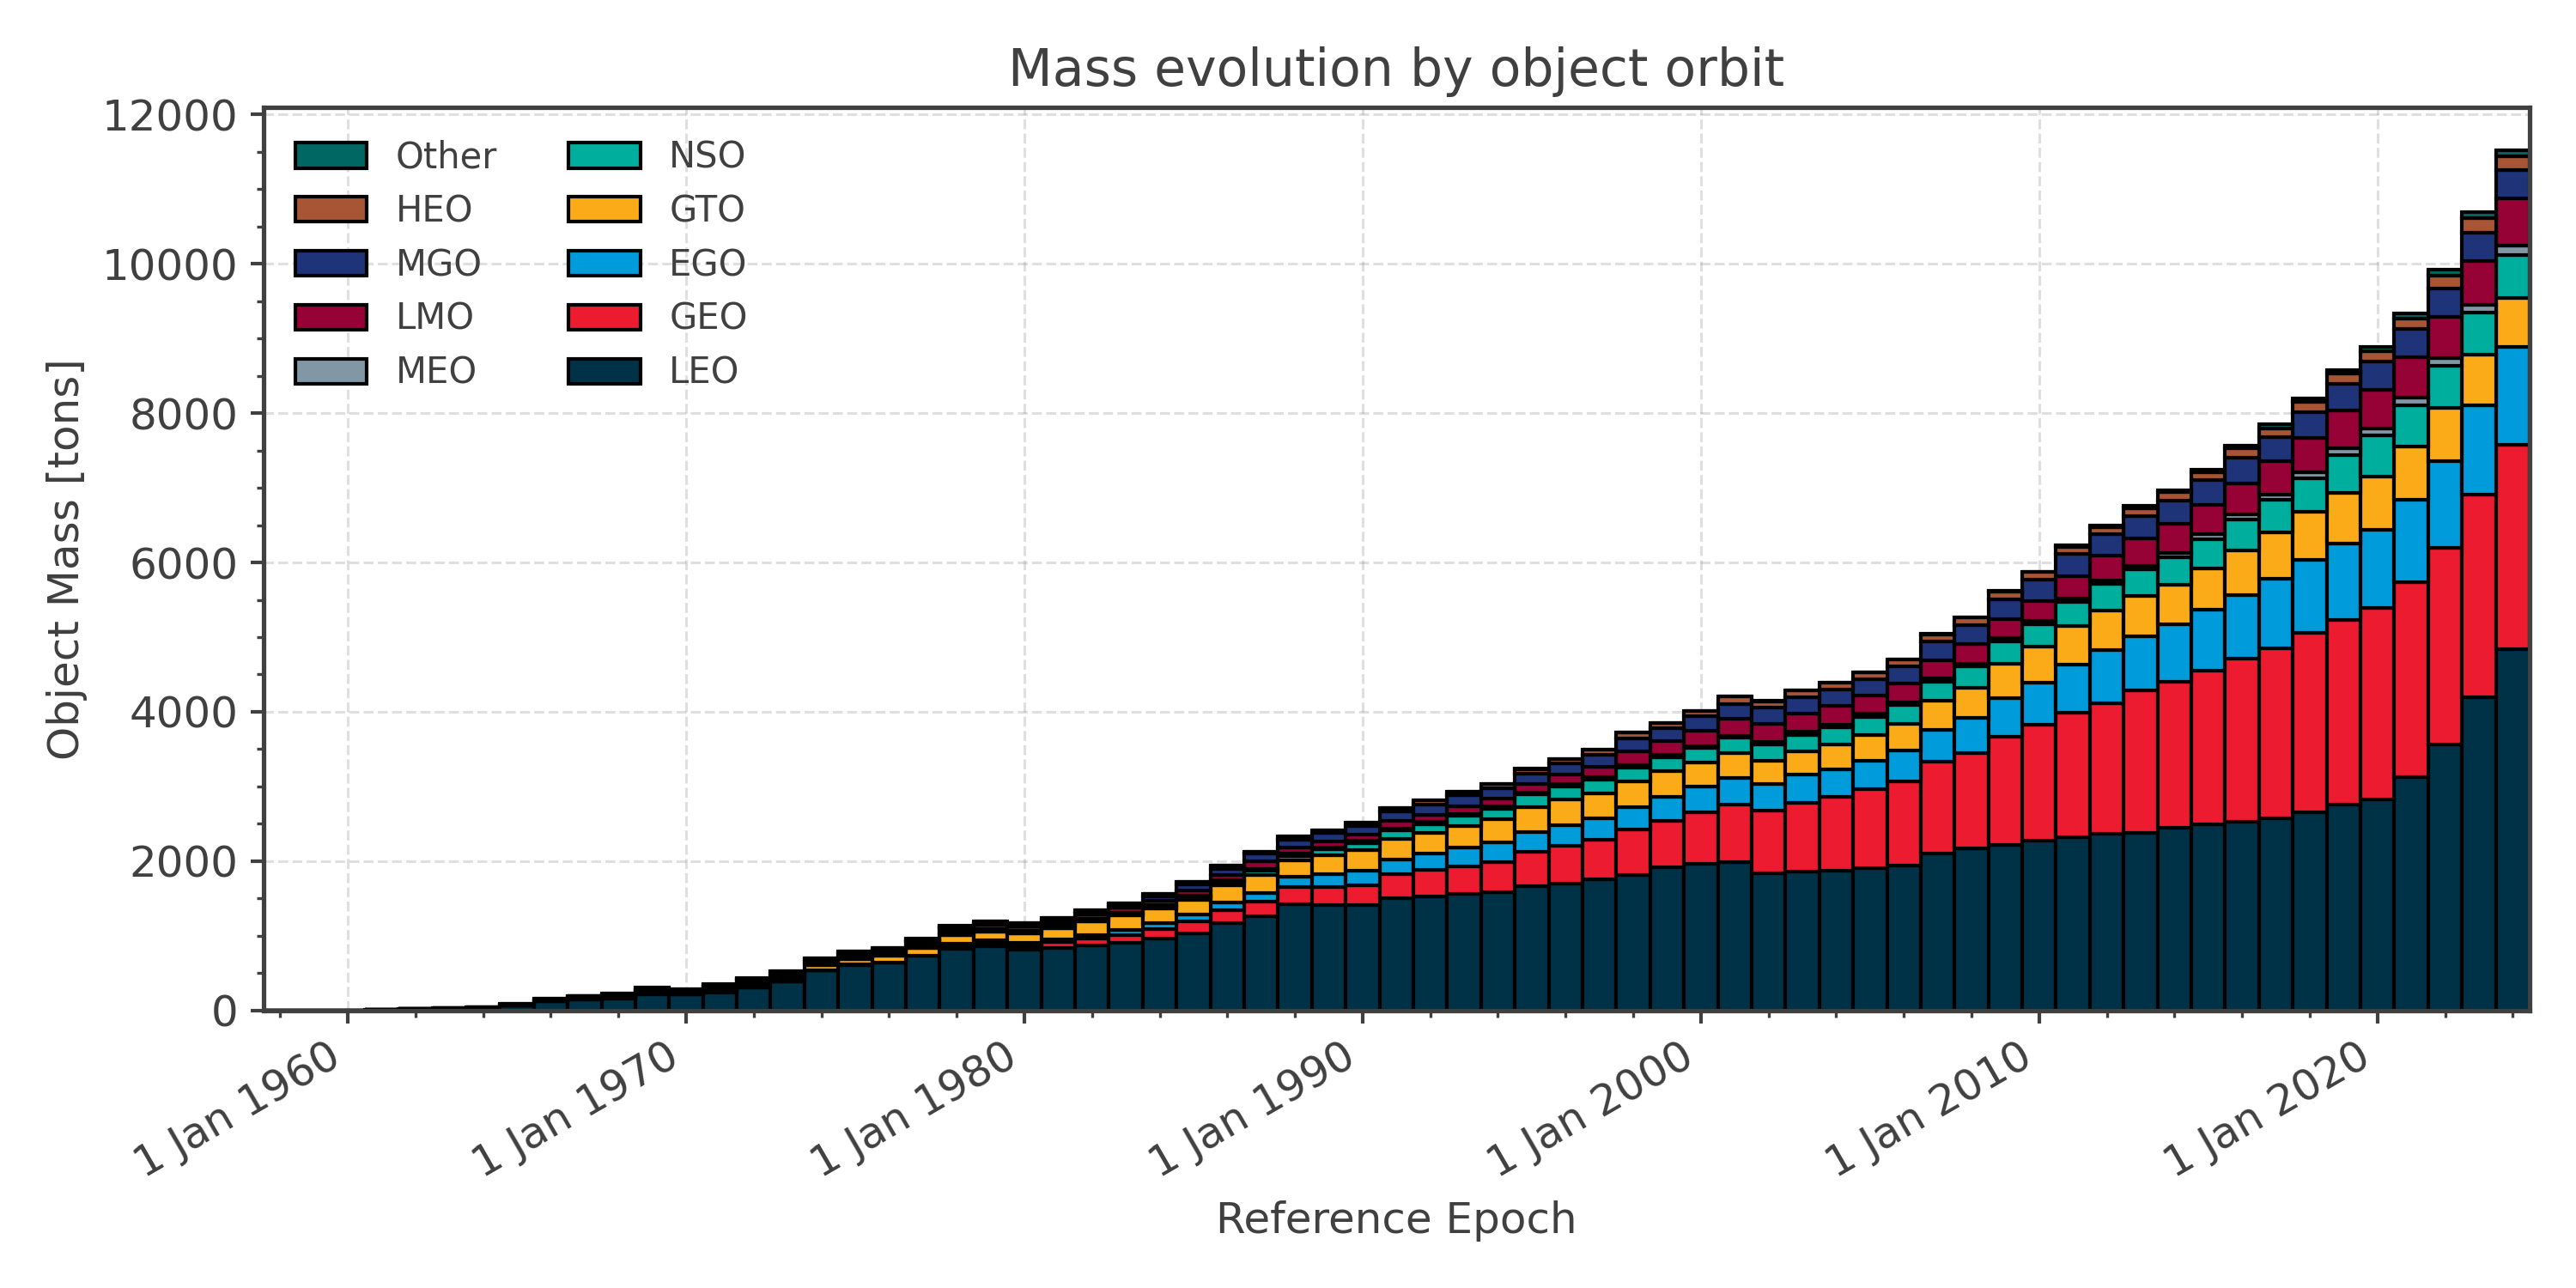
- Total mass of all space objects in Earth orbit
- More than 17000 tonnes
- Not all objects are tracked and catalogued. The number of objects estimated based on statistical models to be in orbit (MASTER-8, reference population 02/2026)
-
68450 space objects greater than 10 cm (including approx. 11300 active payloads)
1.5 million space debris objects from greater than 1 cm to 10 cm
230 million space debris objects from greater than 1 mm to 1 cm
Extended statistics
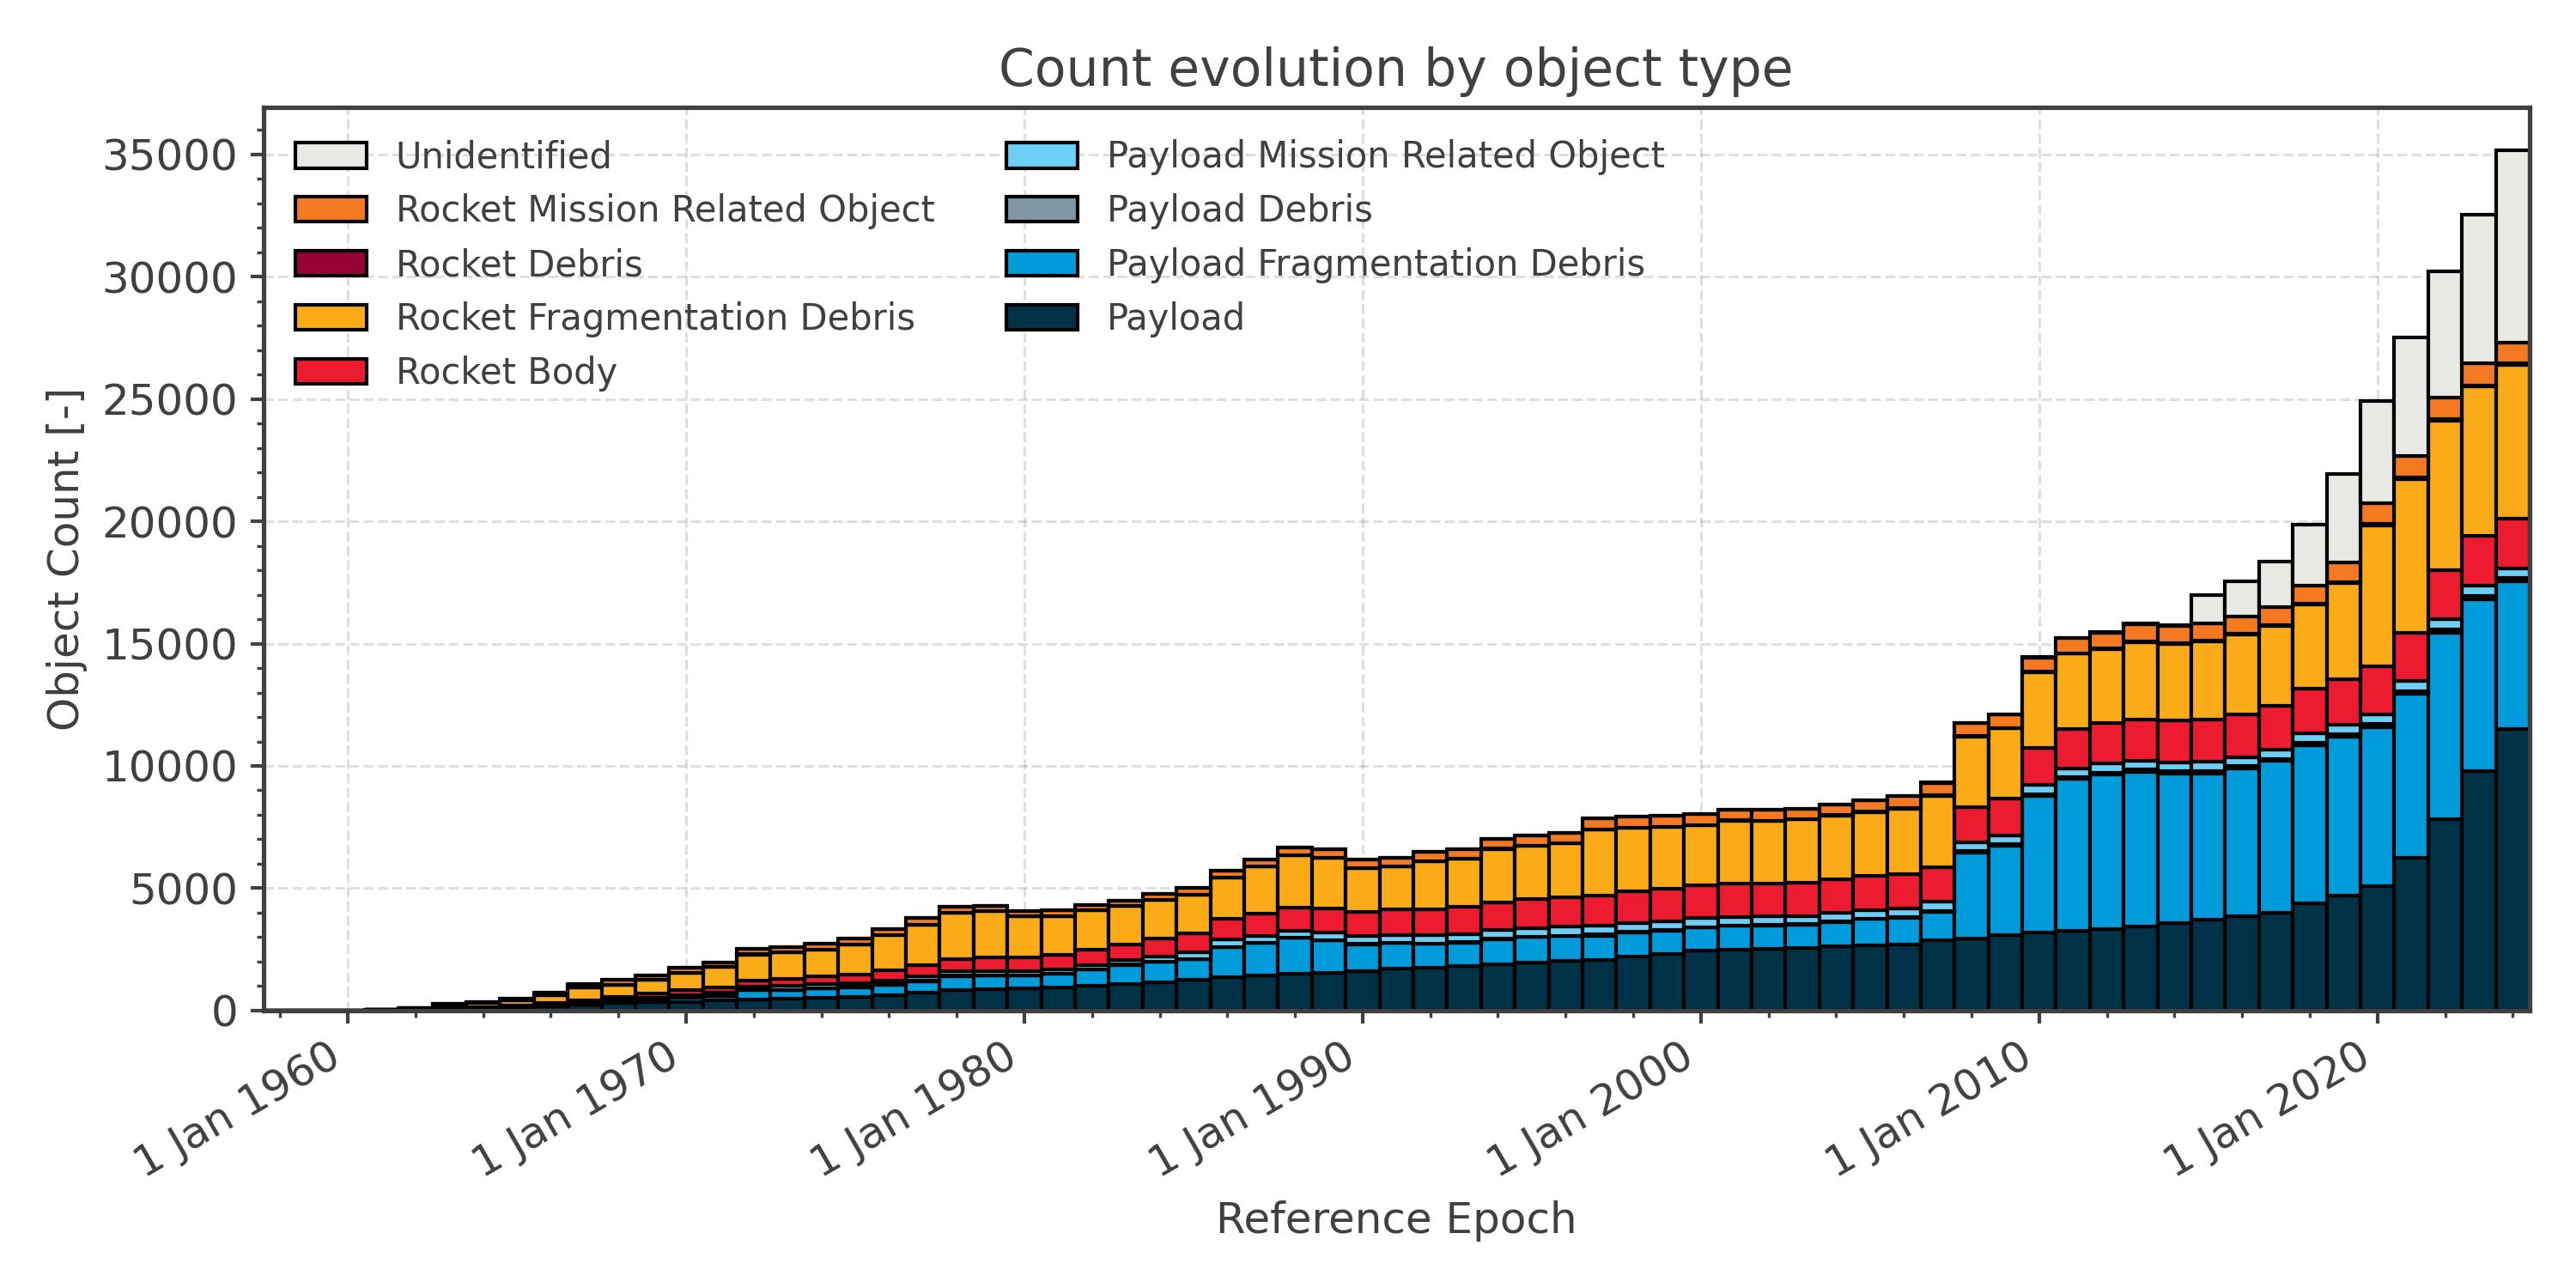
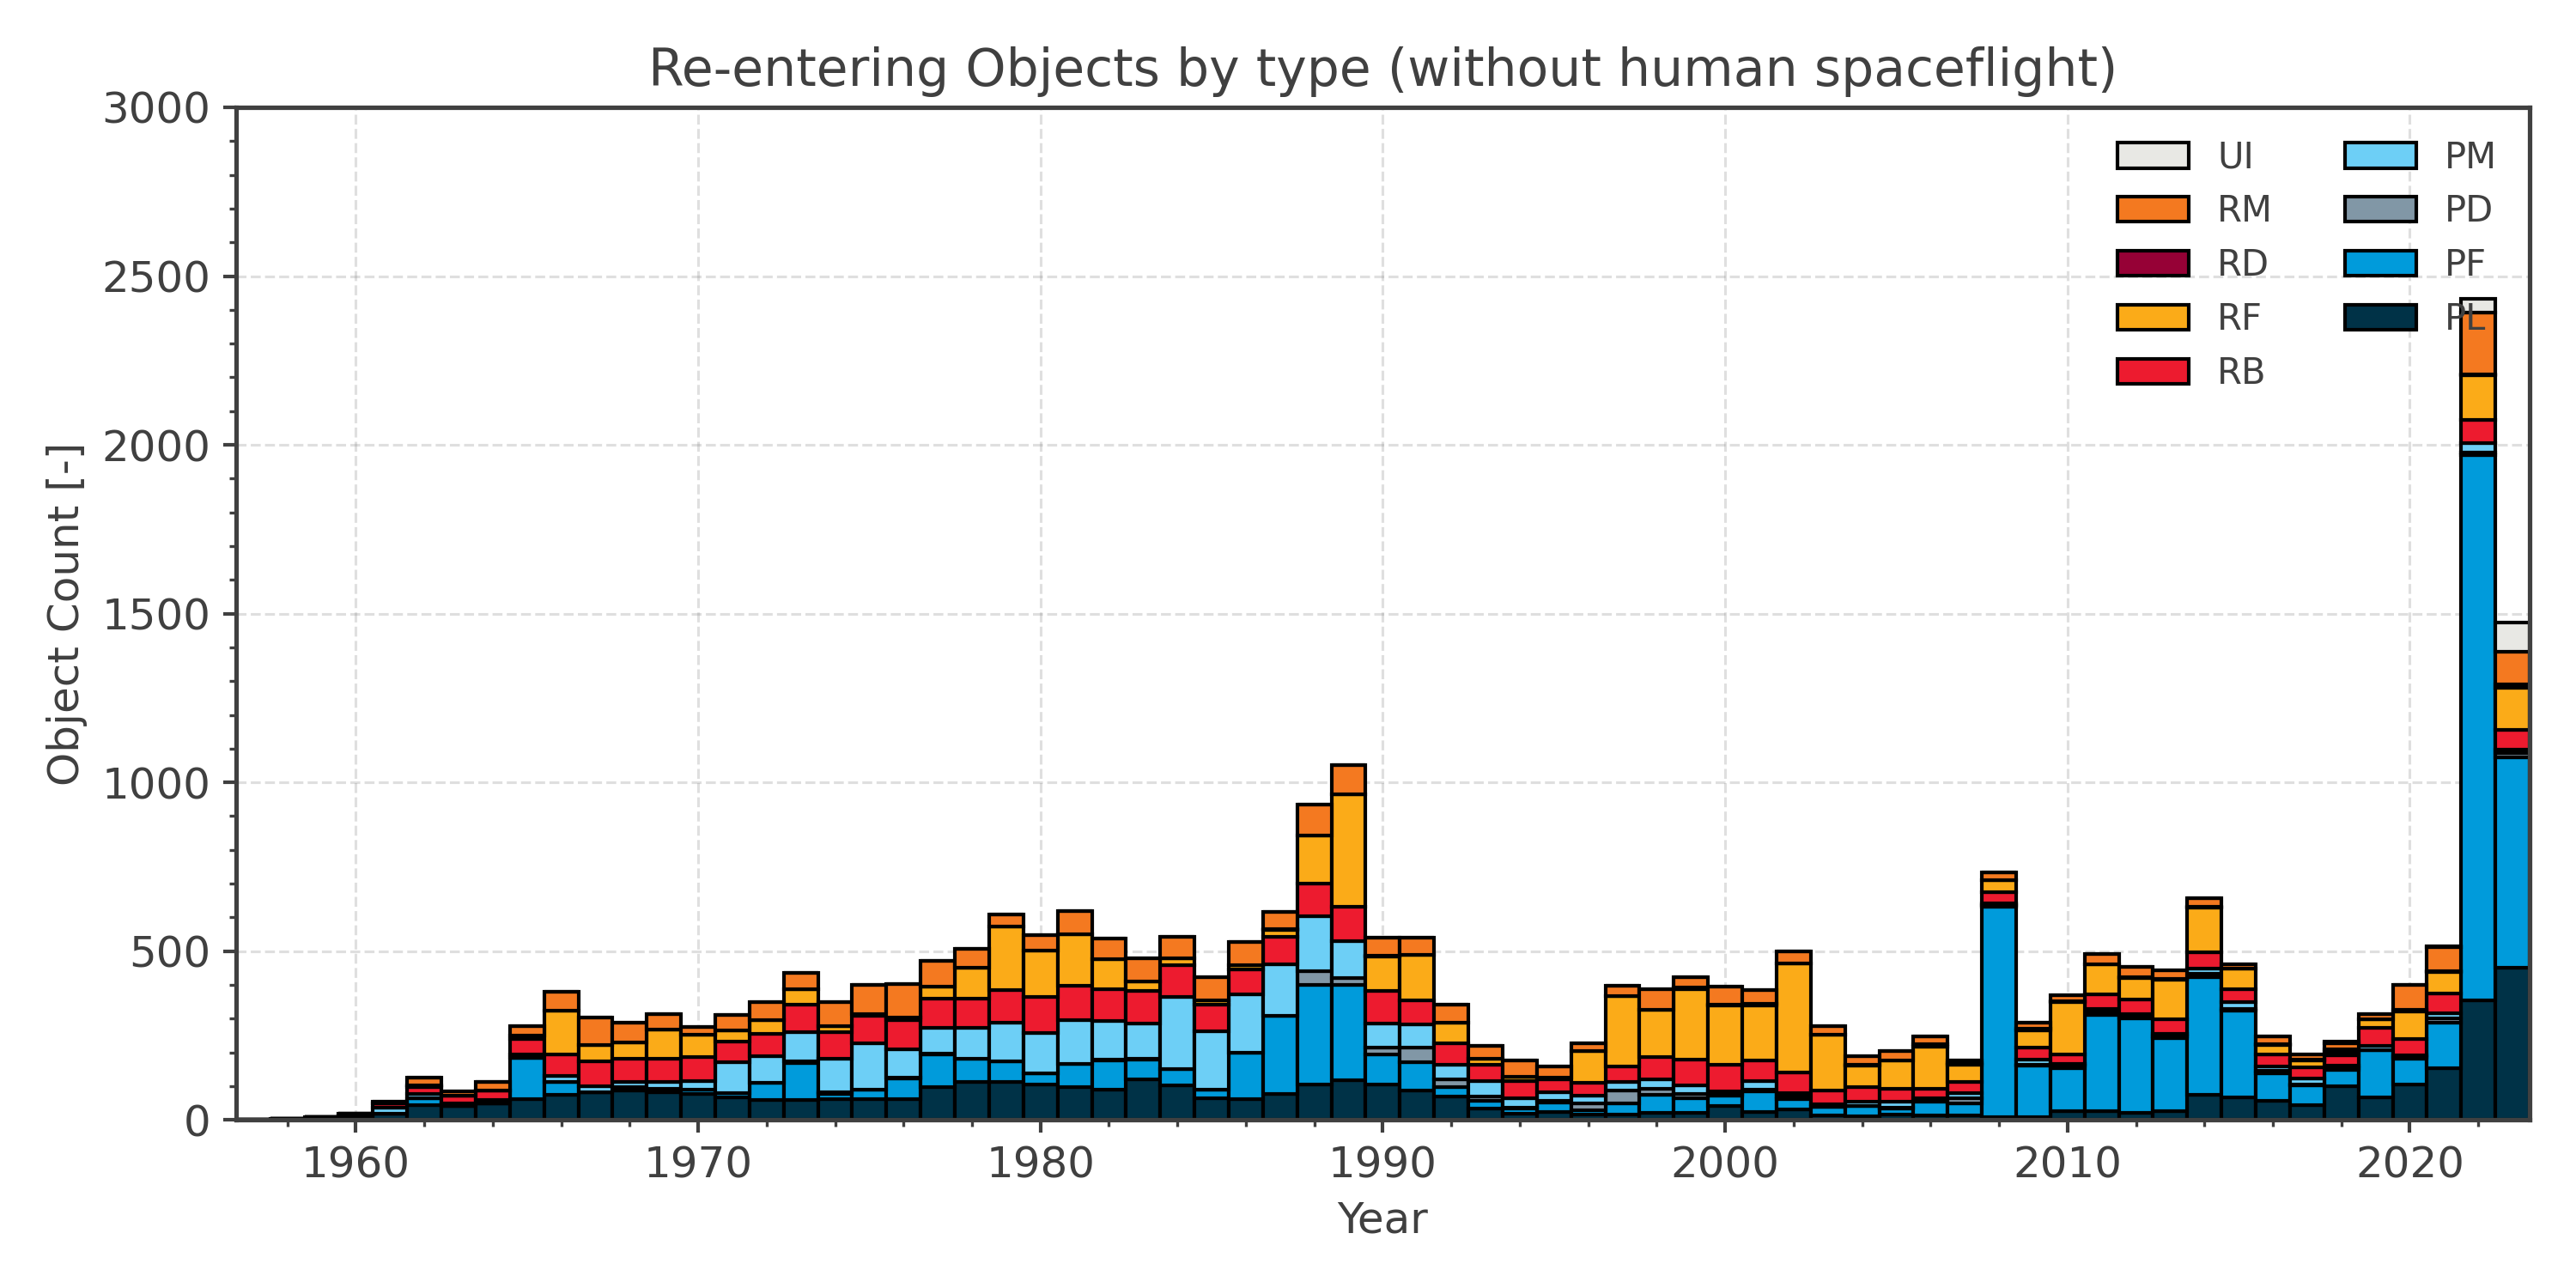
Here we would like to briefly address and summarise some facts on the space environment. This environment is understood to contain all artificial objects, including fragments and elements thereof, which currently, or previously did, reside in an Earth bound orbit. Of specific interest is space debris, defined as all artificial objects including fragments and elements thereof, in Earth orbit or reentering the atmosphere, that are non functional (IADC definition). Objects in the space environment can be categorised in two broad categories: The ones which can be traced back to a launch event and for which the nature can be identified, and the ones for which this is not (yet) possible. The later ones will be identified as Unidentified (UI), whereas the former can be further categorised in:
- Payloads (PL), space object designed to perform specific function in space excluding launch functionality. This includes operational satellites as well as calibration objects.
- Payload mission related objects (PM), space objects released as space debris which served a purpose for the function of a payload. Common examples include covers for optical instruments or astronaut tools.
- Payload fragmentation debris (PF), space objects fragmented or unintentionally released from a payload as space debris for which their genesis can be traced back to a unique event. This class includes objects created when a payload explodes or when it collides with another object.
- Payload debris (PD), space objects fragmented or unintentionally released from a payload as space debris for which the genesis is unclear but orbital or physical properties enable a correlation with a source.
- Rocket body (RB), space object designed to perform launch related functionality; This includes the various orbital stages of launch vehicles, but not payloads which release smaller payloads themselves.
- Rocket mission related objects (RM), space objects intentionally released as space debris which served a purpose for the function of a rocket body. Common examples include shrouds and engines.
- Rocket fragmentation debris (RF), space objects fragmented or unintentionally released from a rocket body as space debris for which their genesis can be traced back to a unique event. This class includes objects created when a launch vehicle explodes.
- Rocket debris (RD), space objects fragmented or unintentionally released from a rocket body as space debris for which the genesis is unclear but orbital or physical properties enable a correlation with a source.
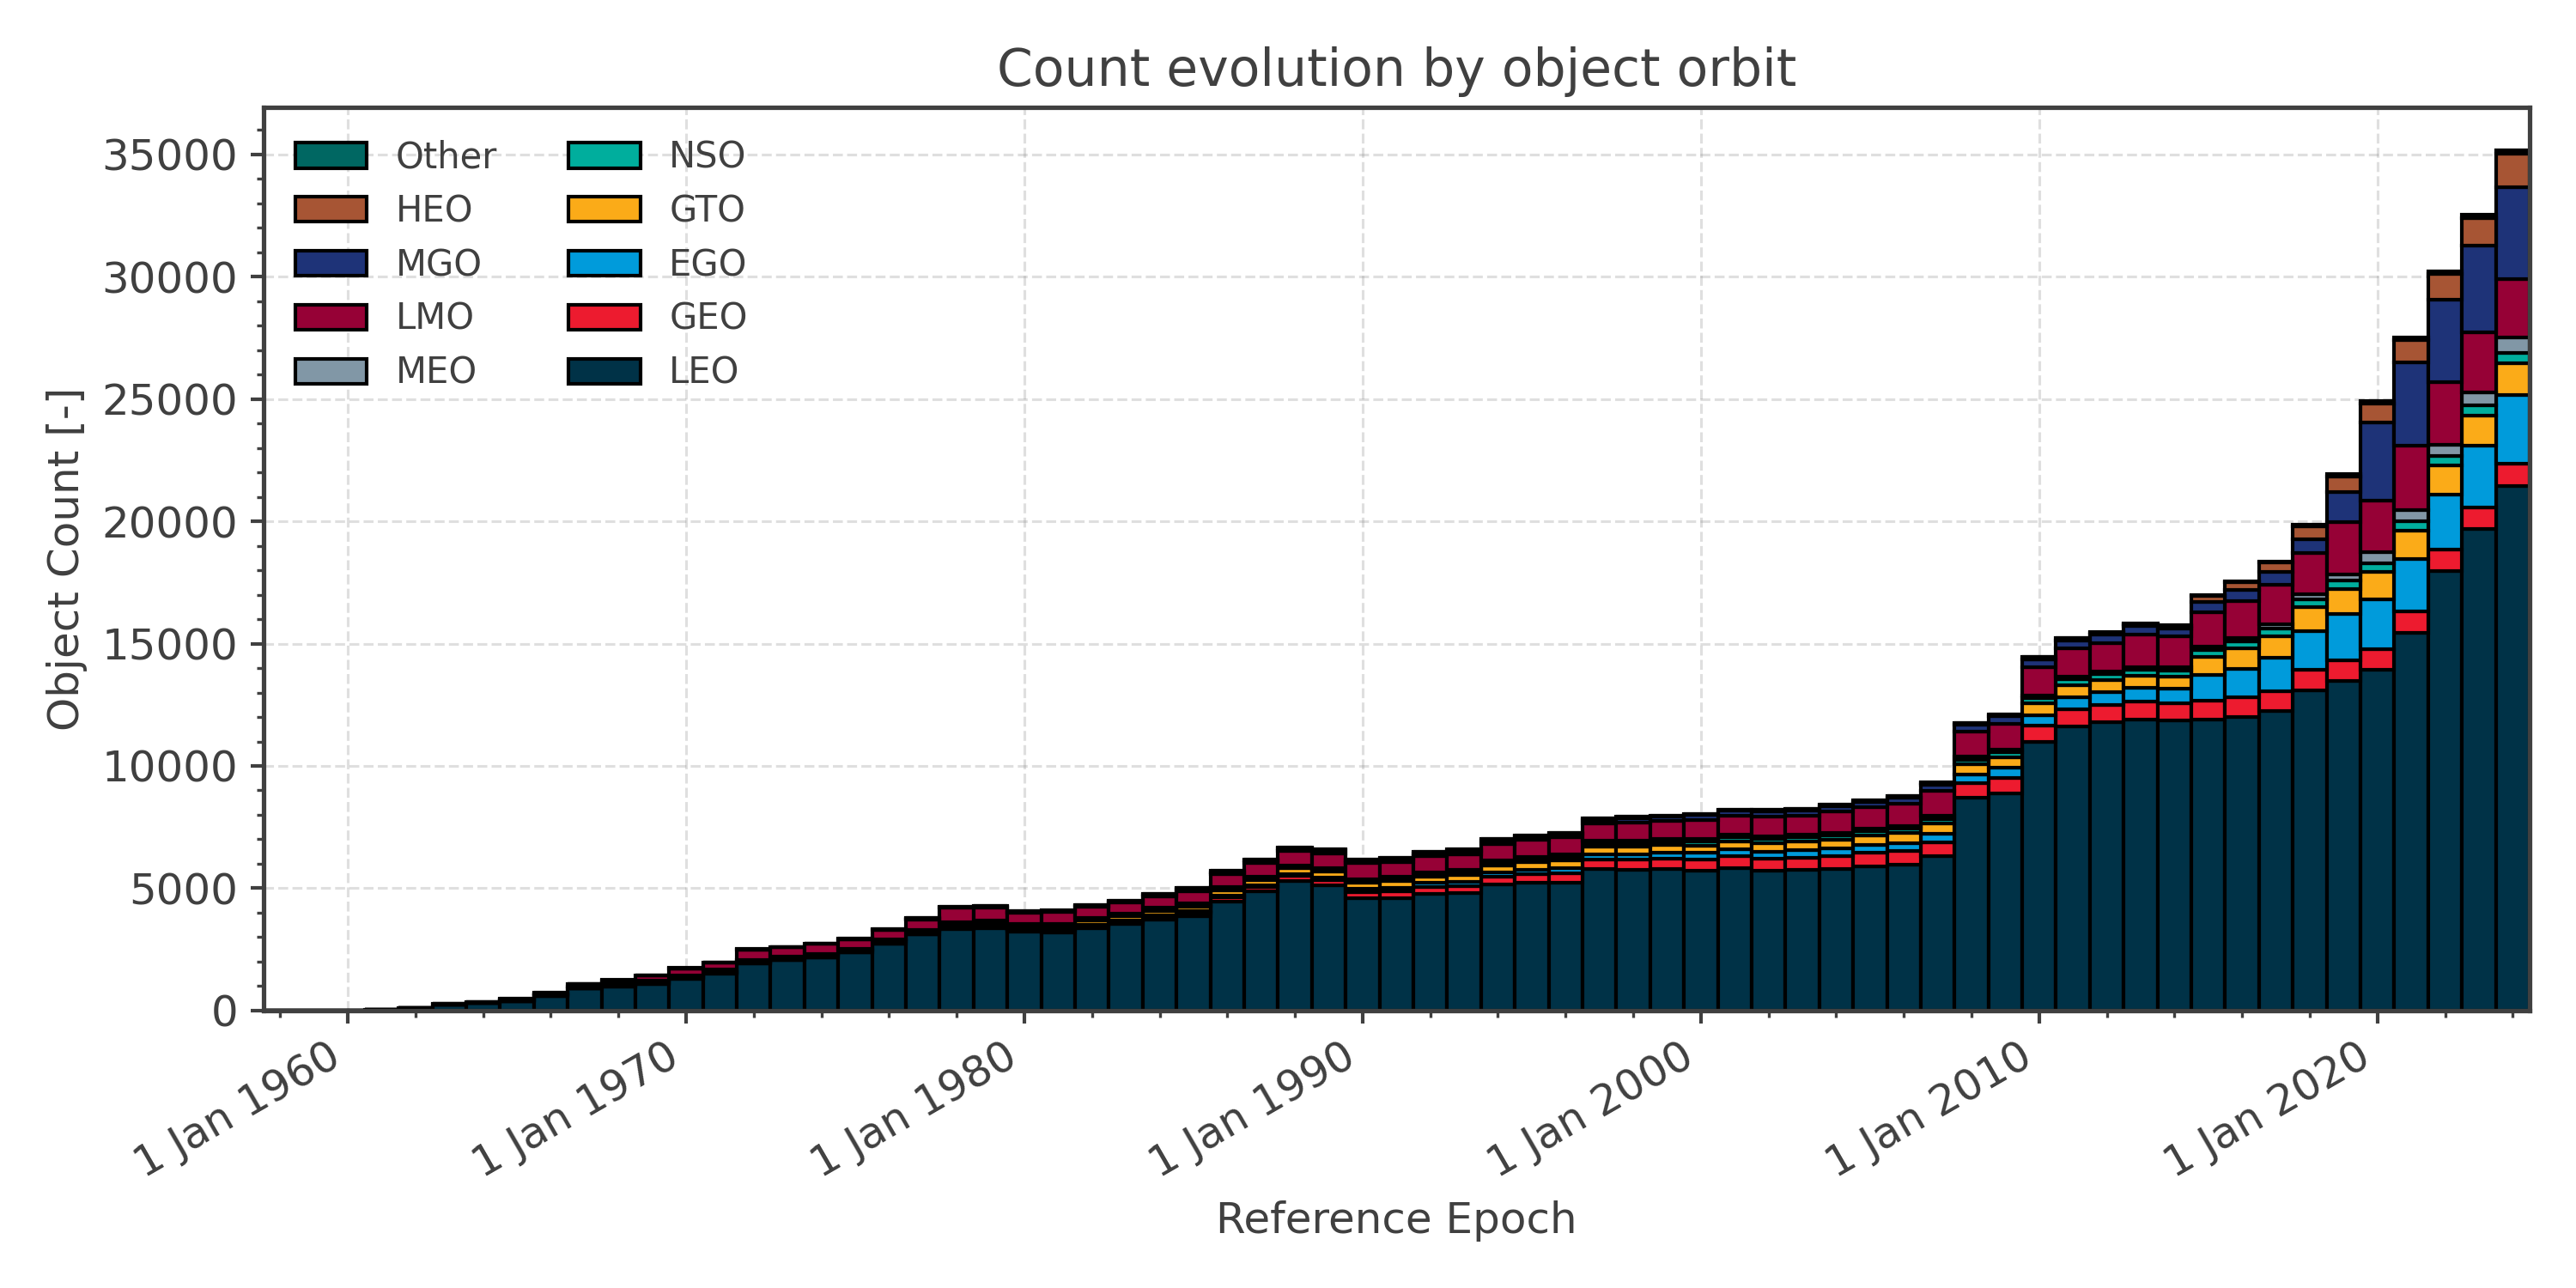
The taxonomy of objects in the space environment can be done based on type as before, but also via the orbital regime in which they reside. A catalogued object will refer to an object whose orbital elements are maintained for prolonged periods of time in a catalogue created by a space surveillance system. An asserted object will refer to an object which has not been reported by a space surveillance system but is known to exist in the space environment by design. Asserted objects include for example rocket bodies which perform a re-entry burn after inserting a payload into orbit prior to consistent detection or tracking by a space surveillance system. As such catalogued and asserted objects are not mutually exclusive and neither one is strictly contained within the other. Catalogued and asserted objects can be categorised in terms of their orbital elements for a given epoch. Orbital regimes used hereafter will be identified based on semi-major axis, eccentricity, inclination, perigee height and apogee height in the table below.
| Orbital regime | Description | Limits |
|---|---|---|
| GEO | Geostationary Orbit | i < 25°, 35586 km < hp < 35986 km, 35586 km < ha < 35986 km |
| IGO | Inclined Geosynchronous Orbit | 37948 km < a < 46380 km, e < 0.25, 25° < i < 180° |
| EGO | Extended Geostationary Orbit | 37948 km < a < 46380 km, e < 0.25, i < 25° |
| NSO | Navigation Satellites Orbit | 50° < i < 70°, 18100 km < hp < 24300 km, 18100 km < ha < 24300 km |
| GTO | GEO Transfer Orbit | i < 90°, hp < 2000 km, 31570 km < ha < 40002 km |
| MEO | Medium Earth Orbit | 2000 km < hp < 31570 km, 2000 km < ha < 31570 km |
| GHO | GEO-superGEO Crossing Orbits | 31570 km < hp < 40002 km, ha > 40002 km |
| LEO | Low Earth Orbit | hp < 2000 km, ha < 2000 km |
| HAO | High Altitude Earth Orbit | hp > 40002 km, ha > 40002 km |
| MGO | MEO-GEO Crossing Orbits | 2000 km < hp < 31570 km, 31570 km < ha < 40002 km |
| HEO | Highly Eccentric Earth Orbit | hp < 31570 km, ha > 40002 km |
| LMO | LEO-MEO Crossing Orbits | hp < 2000 km, 2000 km < ha < 31570 km |
| UFO | Undefined Orbit | |
| ESO | Escape Orbits |
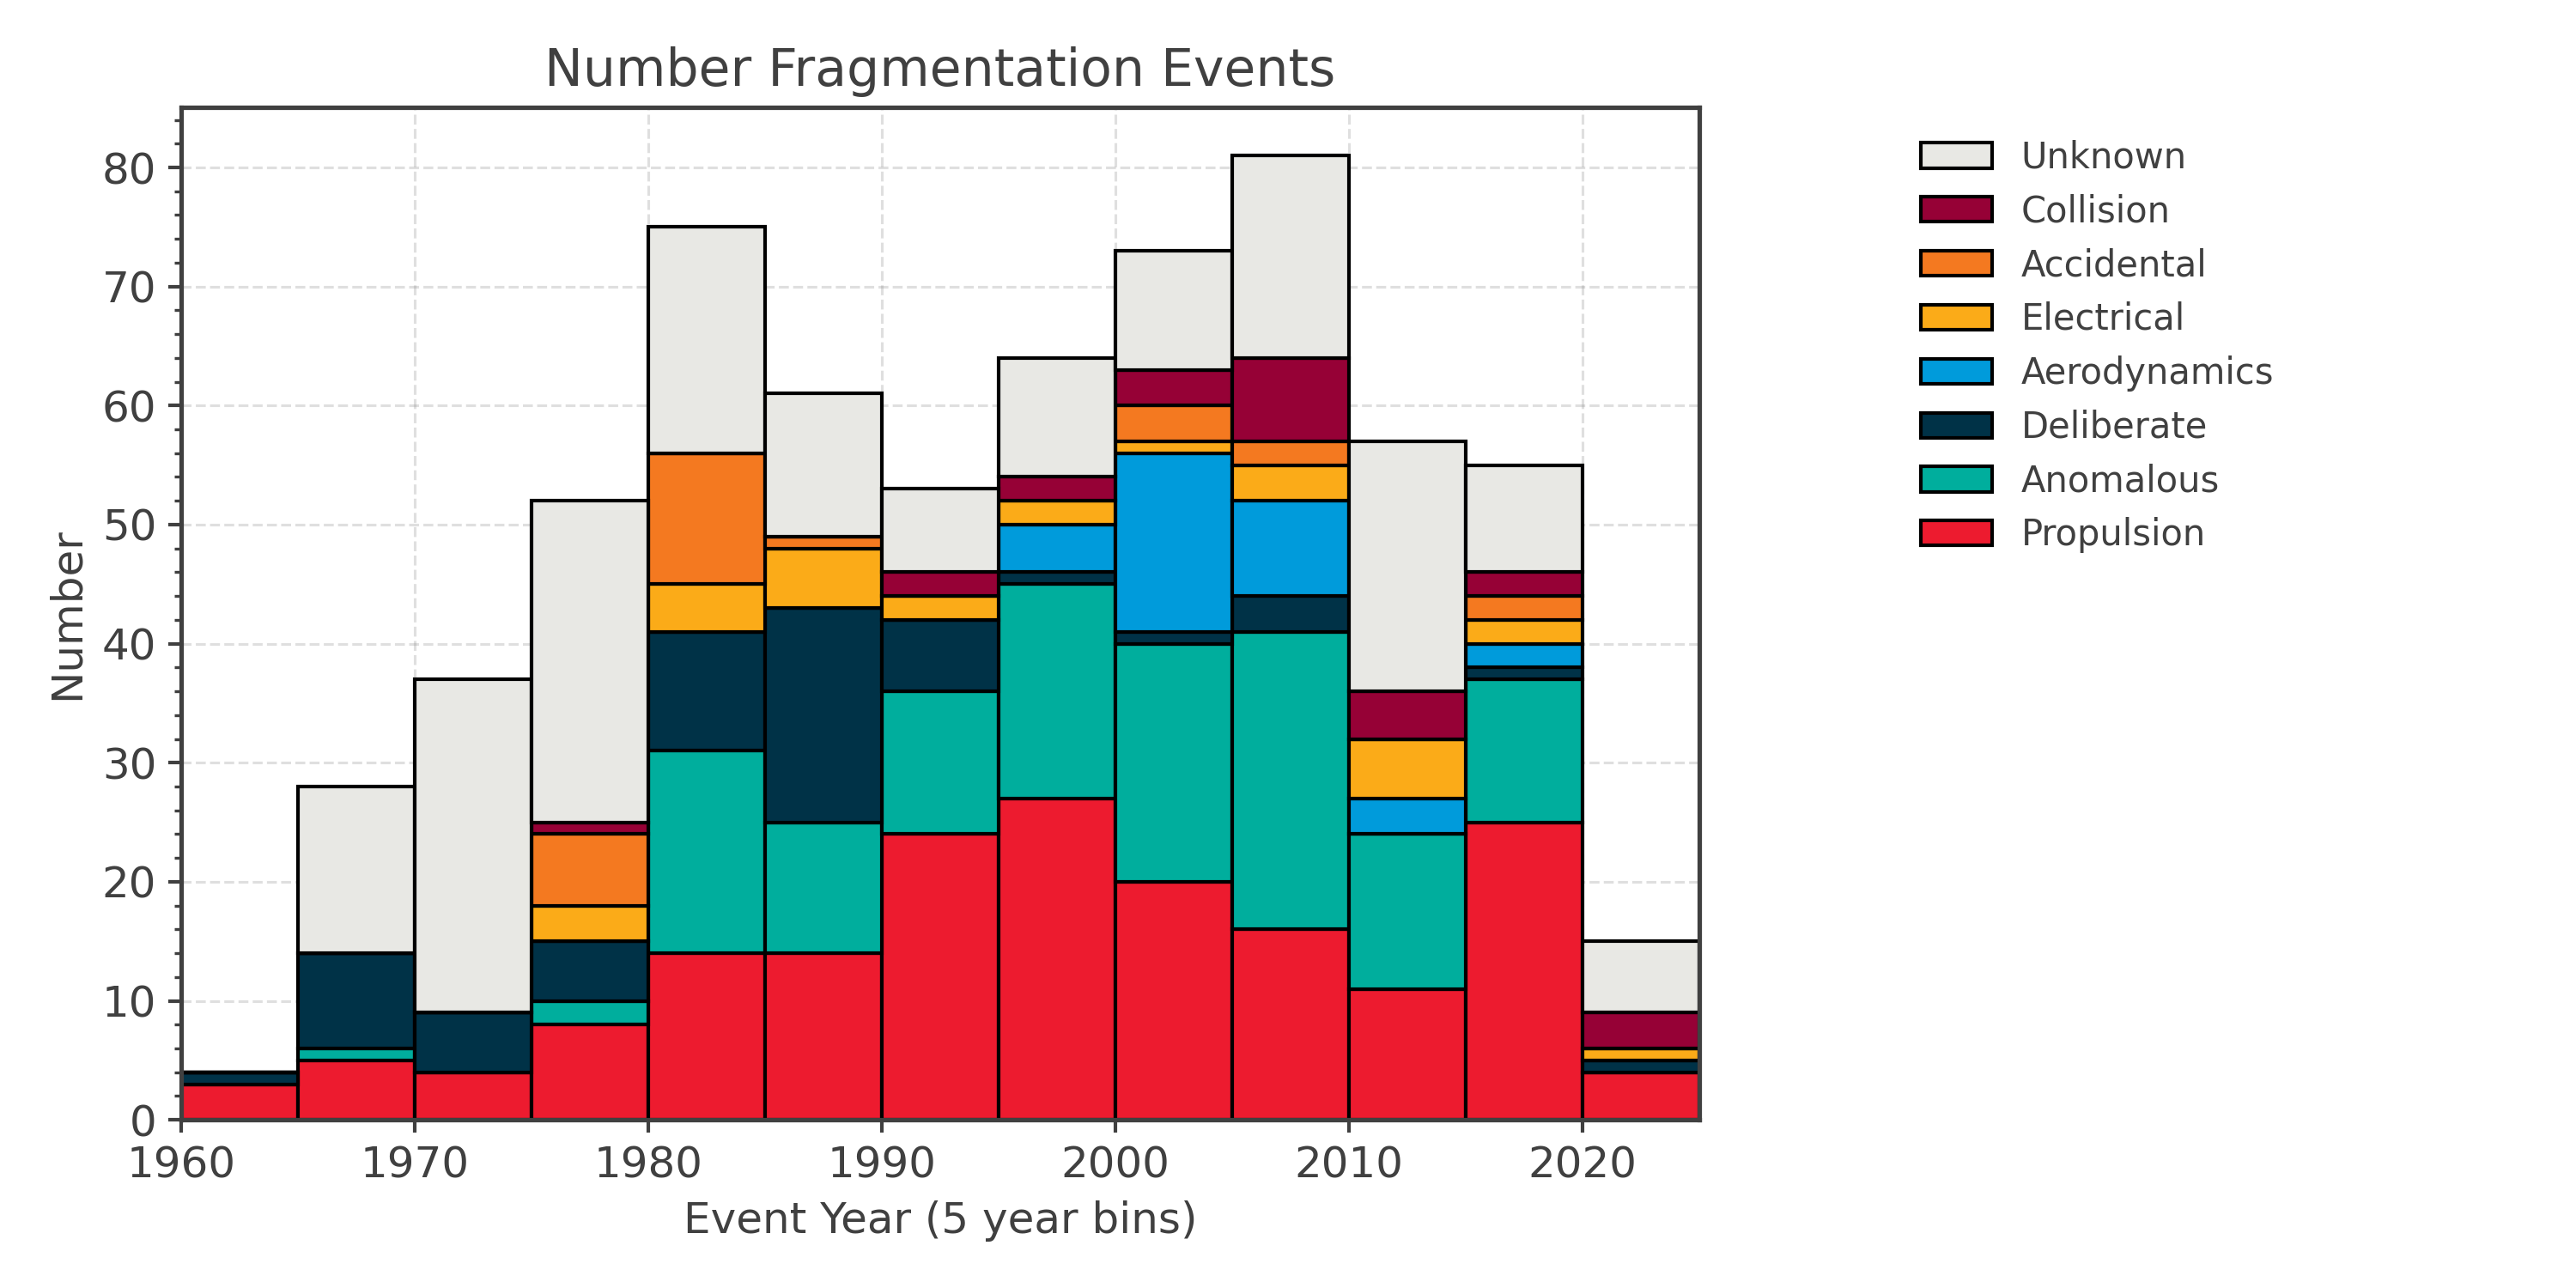
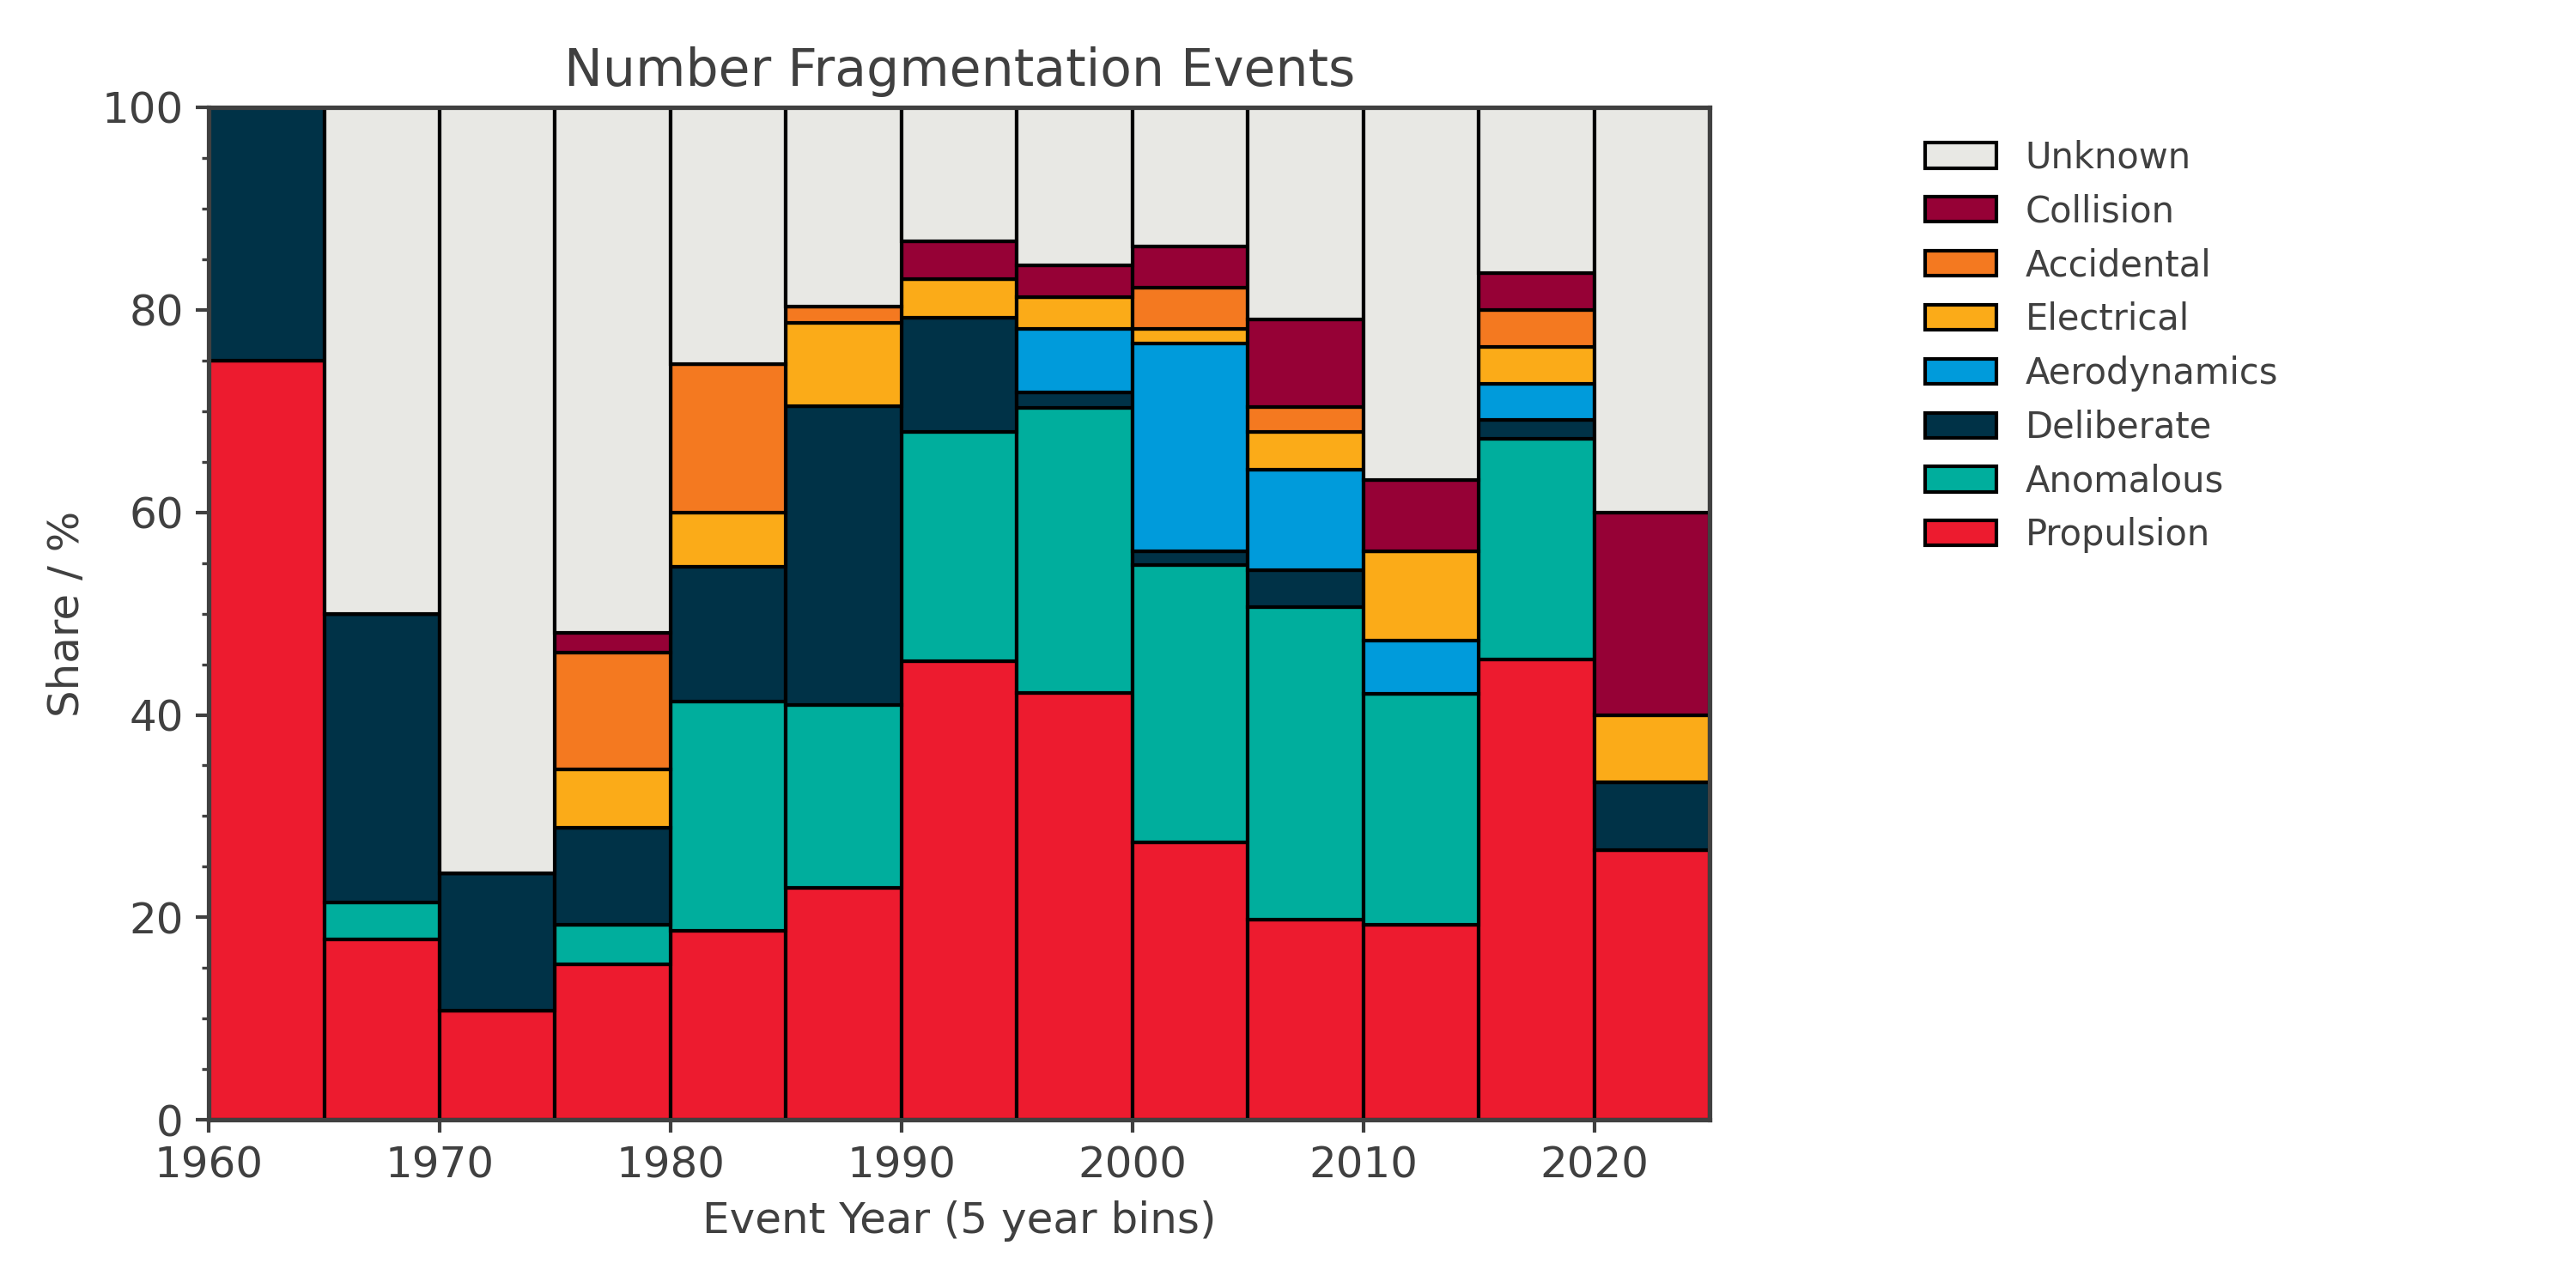
Fragmentation events are currently being categorised according to the assessed break-up cause:
- Accidental: Subsystems which showed design flaws ultimately leading to breakups in some cases.
- Aerodynamics: The break-up occurs due to interaction with the Earth's atmosphere, e.g. on Molniya orbits.
- Anomalous: Defined as the unplanned separation, usually at low velocity, of one or more detectable objects from a satellite that remains essentially intact.
- Collision: There have been four confirmed collision events between catalogued objects so far. Moreover, there were several events reported as anomalies that resulted in several fragments observed on orbits close to the parent satellite in addition to a momentum change for the same satellite. It is likely that in such cases, the satellite suffered a space debris or micro-meteoroid impact.
- Deliberate: Satellites were deliberately destroyed in space. There were several reasons for doing this, e.g. to avoid disclosing the design or the testing of anti-satellite weaponry. Propulsion stored energy for non-passivated propulsion-related subsystems, e.g. fuel tanks, might trigger an explosion.
- Electrical: Stored energy for non-passivated batteries might lead to an explosion, e.g. due to thermal run-away.
- Propulsion: Stored energy for non-passivated propulsion-related subsystems might lead to an explosion, for example due to thermal stress.
- Unknown for events that show fragments but additional evidence is missing to support any of the other categories.
Data presented hereafter will only relate to catalogued objects, and hence next to the increase of the space object population by human activity show the increase in availability of space surveillance networks. The abbreviation OCC (Orbit Control Capacity) will be used to identify Payload objects which can alter their orbit by means of applying demonstrated impulsive or continuous thrust. This thus include all conventional types of space propulsion but not technologies exploiting natural perturbations such as drag or solar sails. Rocket bodies, also described as Stages are all assumed to have OCC. Human spaceflight (HS) related missions are analysed separately, as they tend to skew results in terms of mass and count affected for the space environment and have generally a very high reliability. These mission include manned payloads as well as cargo payloads, but not the rocket bodies which bring them into orbit.
Further details and statistics are provided in ESA's annual space environment report.
Objects in Orbit
| Orbital Regime | PL | PF | PD | PM | RB | RF | RD | RM | UI | Total |
|---|---|---|---|---|---|---|---|---|---|---|
| LEO | 16814 | 4753 | 108 | 212 | 971 | 3534 | 36 | 514 | 1177 | 28119 |
| GEO | 799 | 25 | 3 | 8 | 68 | 0 | 0 | 0 | 49 | 952 |
| EGO | 585 | 701 | 20 | 53 | 202 | 90 | 3 | 5 | 3400 | 5059 |
| GTO | 48 | 19 | 1 | 10 | 214 | 191 | 9 | 43 | 757 | 1292 |
| NSO | 299 | 0 | 0 | 1 | 102 | 0 | 0 | 2 | 52 | 456 |
| MEO | 76 | 3 | 3 | 50 | 29 | 191 | 1 | 3 | 885 | 1241 |
| LMO | 83 | 128 | 3 | 43 | 264 | 589 | 19 | 208 | 964 | 2301 |
| MGO | 70 | 61 | 1 | 3 | 176 | 2658 | 5 | 0 | 2432 | 5406 |
| HEO | 36 | 58 | 0 | 4 | 56 | 116 | 0 | 0 | 1821 | 2091 |
| Other | 41 | 26 | 0 | 4 | 4 | 0 | 0 | 0 | 225 | 300 |
| Total | 18851 | 5774 | 139 | 388 | 2086 | 7369 | 73 | 775 | 11762 | 47217 |
| Orbital Regime | PL | PF | PD | PM | RB | RF | RD | RM | UI | Total |
|---|---|---|---|---|---|---|---|---|---|---|
| LEO | 8276.1 | 3.0 | 0.0 | 3.7 | 1593.4 | 0.0 | 0.0 | 6.1 | 0.0 | 9882.3 |
| GEO | 2735.2 | 0.0 | 0.0 | 1.0 | 139.9 | 0.0 | 0.0 | 0.0 | 0.0 | 2876.1 |
| EGO | 1107.8 | 0.0 | 0.0 | 6.6 | 392.6 | 0.0 | 0.0 | 0.3 | 0.0 | 1507.4 |
| GTO | 94.6 | 0.0 | 0.0 | 1.0 | 460.5 | 0.0 | 0.0 | 19.3 | 0.0 | 575.4 |
| NSO | 395.9 | 0.0 | 0.0 | 0.4 | 232.6 | 0.0 | 0.0 | 0.0 | 0.0 | 628.8 |
| MEO | 98.4 | 0.0 | 0.0 | 0.4 | 52.9 | 0.0 | 0.0 | 4.2 | 0.0 | 155.8 |
| LMO | 76.9 | 0.0 | 0.0 | 9.7 | 562.4 | 0.0 | 0.0 | 85.4 | 0.0 | 734.5 |
| MGO | 98.2 | 0.0 | 0.0 | 1.9 | 296.1 | 0.0 | 0.0 | 0.0 | 0.0 | 396.2 |
| HEO | 59.9 | 0.0 | 0.0 | 0.1 | 139.7 | 0.0 | 0.0 | 0.0 | 0.0 | 199.7 |
| Other | 60.2 | 0.0 | 0.0 | 0.1 | 12.5 | 0.0 | 0.0 | 0.0 | 0.0 | 72.8 |
| Total | 13003.3 | 3.0 | 0.0 | 24.9 | 3882.6 | 0.0 | 0.0 | 115.2 | 0.0 | 17029.0 |
| Orbital Regime | PL | PF | PD | PM | RB | RF | RD | RM | UI | Total |
|---|---|---|---|---|---|---|---|---|---|---|
| LEO | 349964.1 | 23.0 | 0.0 | 28.2 | 11676.5 | 1.3 | 0.0 | 240.9 | 0.0 | 361934.0 |
| GEO | 26210.6 | 0.0 | 23.6 | 8.4 | 1518.2 | 0.0 | 0.0 | 0.0 | 0.0 | 27760.8 |
| EGO | 13661.3 | 0.0 | 0.6 | 45.0 | 4498.9 | 0.0 | 0.0 | 9.7 | 0.0 | 18215.5 |
| GTO | 798.1 | 0.0 | 0.0 | 8.8 | 4805.5 | 0.0 | 0.0 | 521.2 | 0.0 | 6133.6 |
| NSO | 3262.5 | 0.0 | 0.0 | 0.8 | 2027.3 | 0.0 | 0.0 | 0.0 | 0.0 | 5290.7 |
| MEO | 1240.1 | 0.0 | 0.0 | 11.2 | 550.9 | 0.0 | 0.0 | 21.4 | 0.0 | 1823.6 |
| LMO | 622.2 | 0.0 | 0.0 | 31.9 | 5826.9 | 0.6 | 0.0 | 1458.3 | 0.0 | 7939.9 |
| MGO | 949.6 | 0.0 | 0.0 | 14.7 | 3242.2 | 0.0 | 0.0 | 0.0 | 0.0 | 4206.5 |
| HEO | 761.2 | 0.0 | 0.0 | 0.4 | 1384.3 | 0.0 | 0.0 | 0.0 | 0.0 | 2146.0 |
| Other | 478.3 | 0.0 | 0.0 | 0.4 | 79.5 | 0.0 | 0.0 | 0.0 | 0.0 | 558.1 |
| Total | 397948.1 | 23.0 | 24.2 | 149.9 | 35610.2 | 1.9 | 0.0 | 2251.5 | 0.0 | 436008.7 |
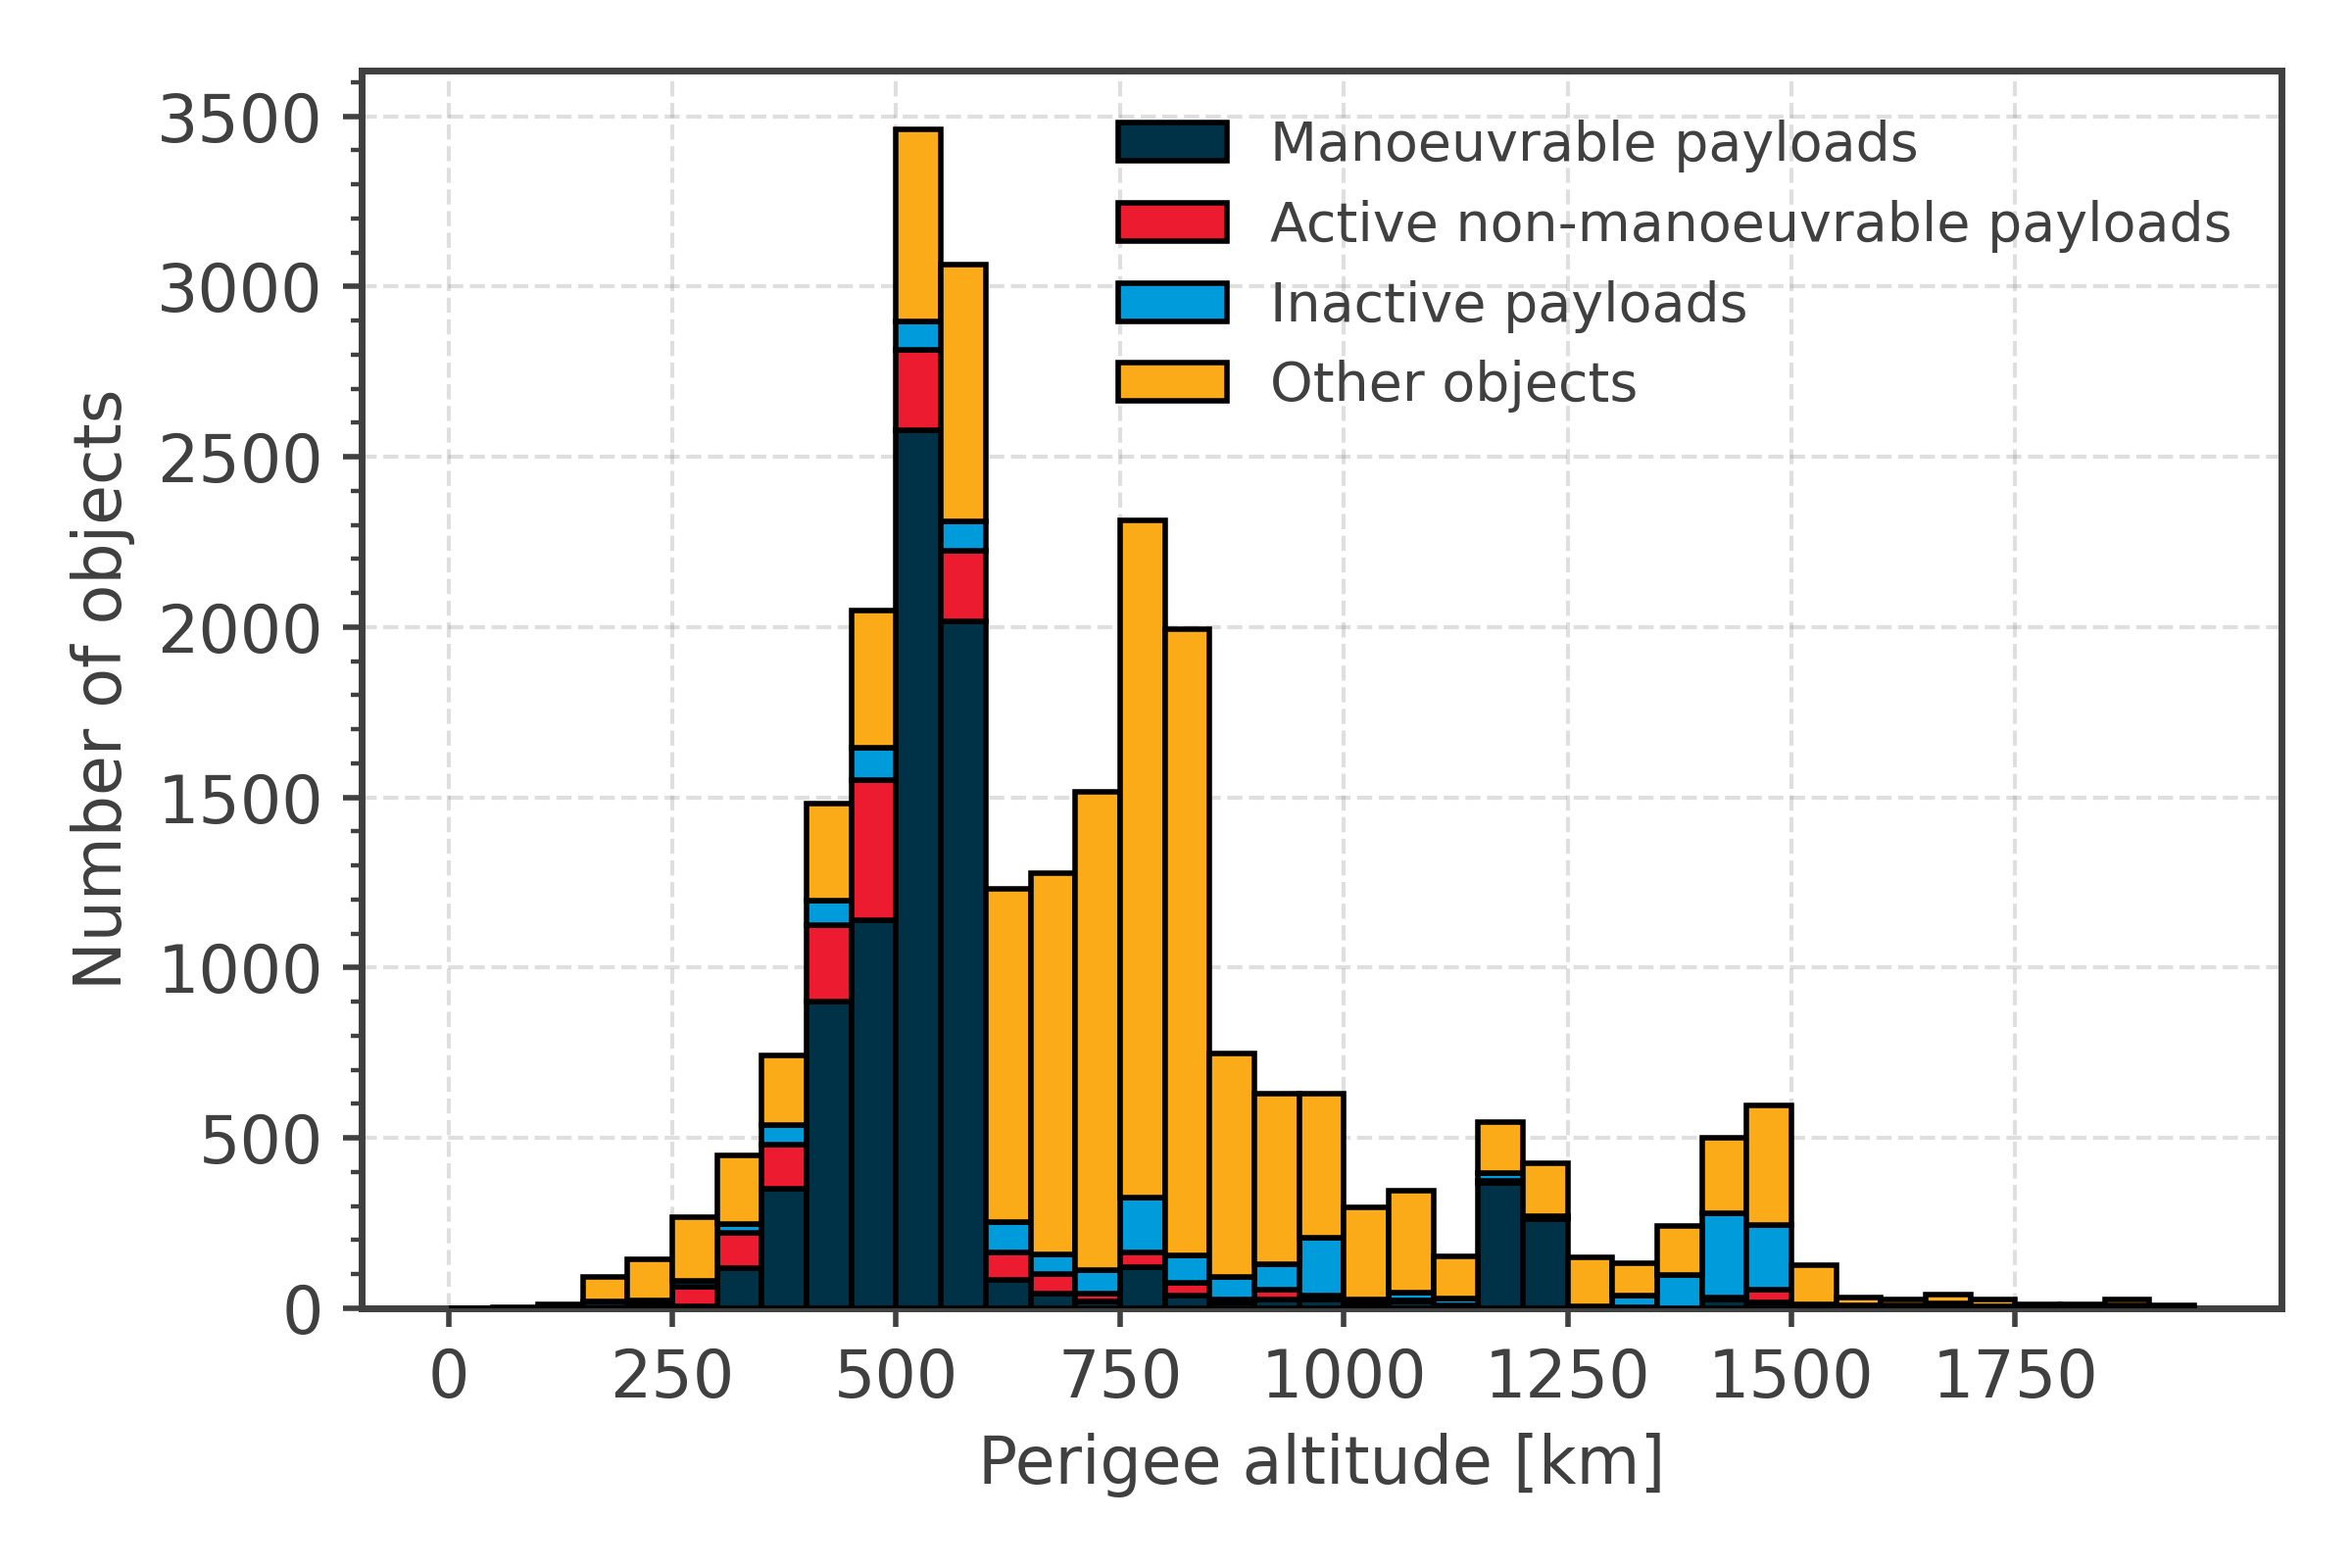
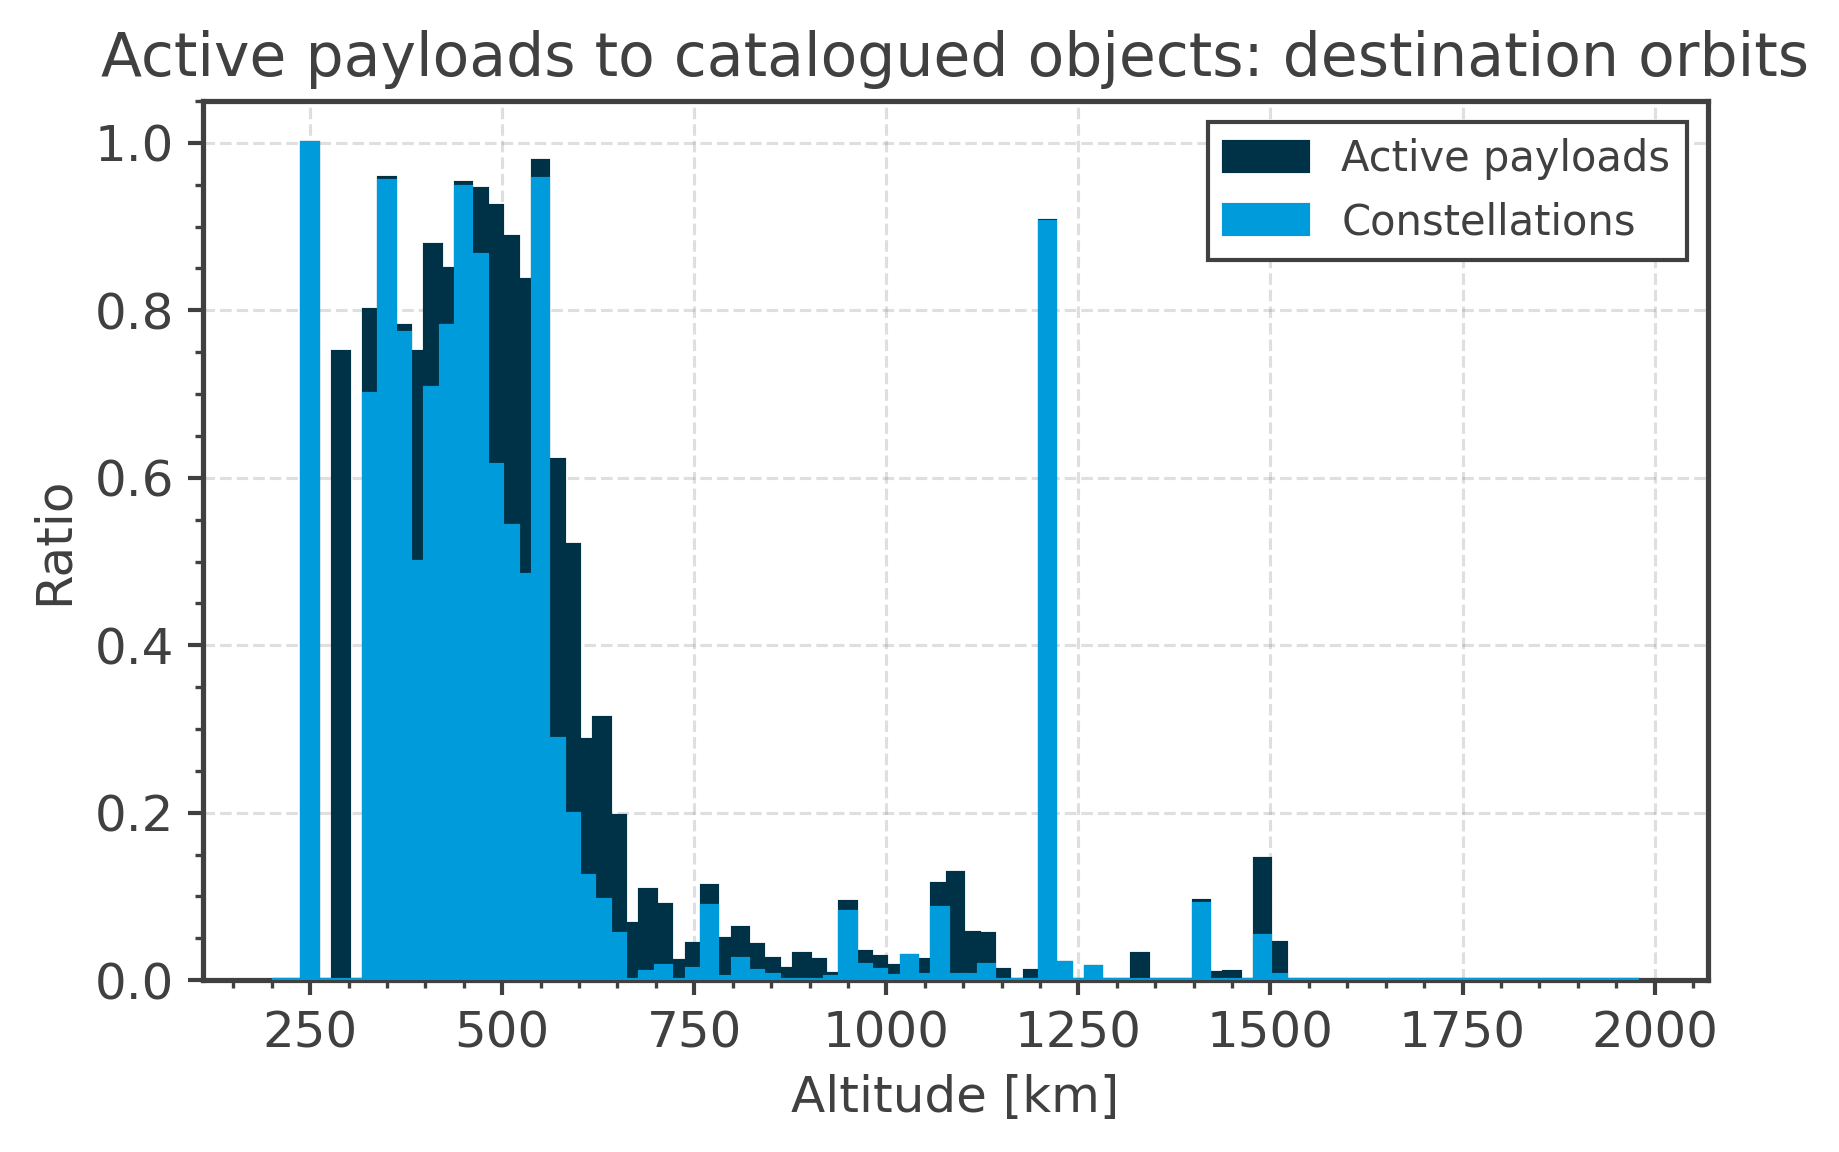
Active Objects in LEO
Re-entering Objects
Fragmentations in Orbit
Missions to LEO and GEO
Archive
- 2017: Space Environment Report, Issue 1,
- 2018: Space Environment Report, Issue 2,
- 2019: Space Environment Report, Issue 3,
- 2019: Keynote speech at AMOS by Dr. Francesca Letizia: slides, transcript.
- 2020: Space Environment Report, Issue 4,
- 2021: Space Environment Report, Issue 5,
- 2022: Space Capacity concept presented at the ESPI Event "Limited Orbital Environments: Capacity Approaches to Outer Space" by Dr. Francesca Letizia: slides.
- 2022: Space Environment Report, Issue 6.
- 2023: Space Environment Report, Issue 7.
- 2024: Space Environment Report, Issue 8.
- 2025: Space Environment Report, Issue 9.
- 2026: Space Environment Report, Issue 10.